Air Quality
Monitoring Network

We all deserve to breathe clean air. Air pollution can cause respiratory and cardiovascular problems, like asthma and heart disease, especially for the most vulnerable populations: children, the elderly, lower-income communities, people of color and those with already compromised respiratory systems.

Why care about air pollution?

According to the CalEnviroScreentool, Watts residents are disproportionately burdened by the effects of air pollution compared to other Californians.

With the growing availability of low-cost air sensors, conducting neighborhood-scale air monitoring can be done to better understand and address air quality issues where people live, work and play. Understanding what you’re breathing can empower you with choices to protect your health.

Additionally, the air quality monitors allow the Watts Rising Collaborative to track air quality levels at different points throughout the TCC grant.

About the Network

The Watts Rising Air Quality Monitoring Network is a network of 13 air sensors located throughout the Watts Rising project area. These sensors measure current levels of particulate matter (PM2.5), nitrogen dioxide (NO2), and ozone pollution (O3). Air quality data and insights from those sensors are posted on this website.

This network was developed to complement the Watts Rising project with air quality insights and came about in response to the community residents’ desire for more neighborhood-level data. The network was designed with significant input and decision-making from community residents, while incorporating technical priorities to ensure scientific integrity.

The program was developed through a partnership between the City of Los Angeles, the County of Los Angeles, South Coast Air Quality Management District, and Sonoma Technology, Inc. The placement of the monitors was determined with essential feedback from the following focus group participants, whom are greatly appreciated:

Pollutants Being Monitored

While there are many pollutants of concern within different communities, this project focuses on those that can be monitored accurately in real time with a dense network of small sensors and that are important to the health outcomes of Watts residents. Therefore, the focus is on particulate matter (PM2.5) and nitrogen dioxide (NO2) at all monitoring sites, as well as ozone (O3) at selected locations. 

Particulate Matter (PM2.5) is the general term used for a mixture of solid particles and liquid droplets found in air. PM2.5 results from motor vehicles (tailpipes and brake pads), industrial processes, construction, windblown dust, wood burning, and other combustion sources. Due to the small size, PM2.5 poses a greater health risk, because they can get deep into the lungs and may even get into the bloodstream. Exposure to particle pollution can result in increased hospital admissions, emergency room visits, absences from school or work, and restricted activity days, especially for those with pre-existing heart or lung disease, older people, and children. 

Nitrogen oxides (NOx) are a group of gases consisting of nitrogen and oxygen in varying amounts. The two NOx compounds of most health concern are nitrogen oxide (NO) and NO2. The most common source of NOx is motor vehicle exhaust, but certain industrial processes at facilities including refineries, power plants, chemical plants, and hazardous waste incinerators also generate this pollution. NOx is a major contributor to smog and exposure to this pollutant can damage the airway and make allergic responses in asthmatics worse. 

Ozone (O3) is a colorless gas formed through a complex series of photochemical reactions involving sunlight and heat known commonly as “smog”. It is not emitted directly into the air, but instead is formed from directly emitted “precursor” pollutants—reactive volatile organic compounds (VOCs) and oxides of NOx—in the presence of sunlight. Breathing ozone can trigger a variety of health problems including chest pain, coughing, throat irritation, and airway inflammation. Children are at greatest risk from exposure to ozone because their lungs are still developing and they are more likely to be active outdoors when ozone levels are high, which increases their exposure.

Sensors

Clarity Node-S

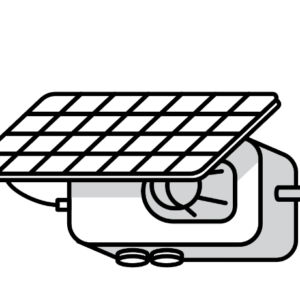
Seven (7) Clarity’s Node-S air sensors are installed in the project area. These sensors are a cellular-connected, solar-powered device that monitor PM2.5 and NO2 as well as temperature and relative humidity. The sensors provide a robust mechanism to monitor traffic-related air pollution.

Aeroqual AQY

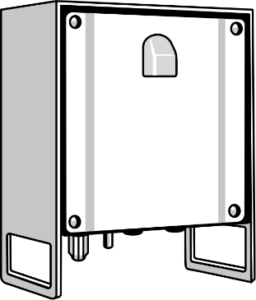
Six (6) Aeroqual AQY sensors are installed in the project area. Aeroqual’s AQY v1.0 air sensor is a cellular-connected, line-powered device that monitors PM2.5, NO2, and O3 as well as temperature and relative humidity. The addition of ozone to the pollutants studied by this project (PM2.5 and NO2) enables the community to fully understand its exposure to the primary pollutants used.

Study map area

Below you can access quarterly air quality insights from the Watts Rising Air Quality Monitoring Network:

Take Action to Protect Your Health

For actions you can take to safeguard your health from air pollution year-round, visit LA’s Green New Deal Toolkit and check out the Monitoring and Improving Air Quality in Your Neighborhood and Household Action Guide.